How do you truly know your exams are fair, secure, and upholding academic standards? In today's educational landscape, maintaining the integrity of assessments is more challenging than ever. With the rise of online learning and sophisticated cheating methods, institutions face immense pressure to protect their reputation and ensure the validity of credentials.
Recent studies reveal that 60-70% of high school students admit to cheating behaviors, and a staggering 64% of college students confess to cheating on tests. Despite this widespread issue, less than 2% of students report being caught. These numbers highlight a critical gap: the need for robust systems that don't just detect incidents but also provide comprehensive insights into the overall health of your assessment environment.
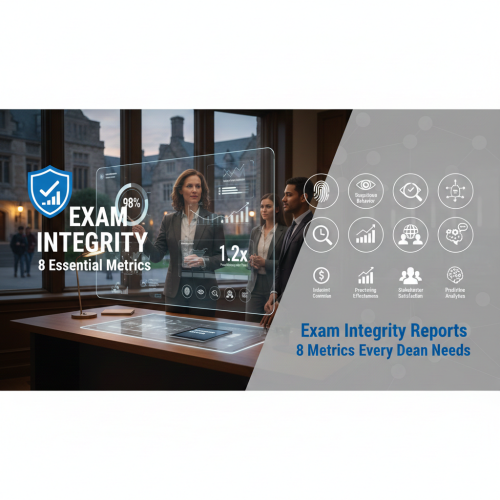
This article will guide you through eight essential exam integrity metrics that every dean and assessment leader needs to track. These metrics move beyond simple incident counts, offering a strategic framework to measure the effectiveness of your integrity initiatives, justify technology investments, and ensure compliance with regional regulations.
Why Exam Integrity Analytics Matter More Than Ever
The academic world is constantly evolving, and with it, the methods students use to circumvent fair assessment. Educators reported a significant increase in cheating in 2024, partly due to the accessibility of AI-powered tools. In 2023, 11% of 22 million Turnitin submissions contained at least 20% AI-generated content, showcasing the new frontiers of academic dishonesty.
Beyond the immediate challenge of detecting cheating, institutions must contend with accreditation bodies and regional compliance pressures. Proving that your assessment processes are secure and fair is paramount for maintaining institutional reputation and accreditation status. Robust exam integrity analytics offer the data-driven evidence needed to satisfy these rigorous requirements.
Investing in solutions that enhance assessment security also demonstrates a clear return on investment (ROI). Effective proctoring and integrity solutions can reduce the time spent on manual investigations, minimize appeals, and uphold the value of your degrees. By shifting from a reactive approach, where institutions only respond to incidents, to a proactive one driven by data, you can build a more resilient and trustworthy assessment ecosystem.
The 8 Essential Exam Integrity Metrics
To gain a holistic view of your assessment landscape, focusing on a few key data points isn't enough. A comprehensive approach involves tracking metrics that cover identification, detection, resolution, compliance, and overall effectiveness. Here are eight practical metrics that will empower deans and assessment leaders to make informed decisions.
1. Identity Verification Success Rate
This metric measures the percentage of test-takers who successfully complete the identity verification process before starting an exam. This often involves biometric checks, ID scanning, or live human verification. A high success rate confirms that your systems are effectively confirming the test-taker's identity.
Identity verification is the foundational step of exam integrity. Without it, even the most sophisticated proctoring systems can be bypassed. Tracking this rate helps you identify issues with your verification technology, the clarity of instructions for students, or common points of failure in the process. Aim for a consistently high success rate, ideally above 95%, to ensure a solid start to every secure exam.
To improve this rate, ensure your identity verification tools are user-friendly and provide clear, step-by-step instructions. Offer technical support readily available for students encountering issues. Regularly review common failure points and update your verification protocols or software as needed. This proactive approach helps prevent unnecessary delays and frustration for students.
2. Suspicious Behavior Detection Rate
The suspicious behavior detection rate quantifies how often potential integrity violations are flagged per 100 exams. This metric gives you insight into the prevalence of suspicious activities within your proctored assessments. These behaviors might include unauthorized material detection, gaze aversion, or communication attempts.
This metric acts as an early warning system, indicating where and how students might be attempting to cheat. While a higher rate might initially seem concerning, it can also signify that your proctoring system is highly effective at identifying questionable actions. The key is to balance detection with minimizing false positives, which can lead to unnecessary investigations and student complaints.
To optimize this rate, regularly review flagged incidents to understand patterns and refine your detection parameters. Work with your proctoring provider to adjust AI algorithms or human review protocols to reduce false positives while maintaining vigilance. Providing clear guidelines to proctors and faculty on what constitutes actionable suspicious behavior is also crucial.
3. Incident Resolution Time
Incident resolution time measures the average duration it takes from the moment a suspicious incident is flagged to its final resolution. This includes the investigation, faculty review, and any subsequent disciplinary actions. Efficient resolution is vital for operational efficiency and maintaining fairness.
Prompt incident resolution minimizes uncertainty for students and faculty alike, ensuring that integrity issues are addressed in a timely manner. Delays can lead to backlogs, erode confidence in the system, and potentially impact student academic progress. Swift resolution also helps in delivering a consistent and fair student experience.
To reduce resolution time, establish clear, standardized workflows for incident review and decision-making. Provide adequate training for faculty and administrative staff involved in the process. Leverage reporting tools that offer quick access to incident details and streamline
communication between all stakeholders. Consider automated notifications to expedite reviews.
4. Compliance Coverage Percentage
This metric indicates the percentage of your exams that adhere to relevant regional and institutional compliance standards. These standards can include data privacy regulations like GDPR and FERPA, accessibility requirements, or specific accreditation mandates. High compliance coverage is essential for legal defensibility and institutional standing.
Ensuring compliance is not just about avoiding penalties; it's about building trust and protecting student data. For deans, proving compliance is often a requirement for accreditation and helps secure the institution's reputation. Ignoring compliance can lead to significant legal and financial repercussions, as well as damage to public perception.
To enhance your compliance coverage, map your exam integrity processes against specific regulatory requirements for each region where your students reside. Regularly audit your proctoring solution's capabilities against these standards. Develop robust documentation processes that clearly demonstrate how each exam meets necessary compliance thresholds. Work closely with legal counsel and IT security teams.
5. Candidate Integrity Score Distribution
This metric analyzes the distribution of integrity scores across your entire student population or specific courses. Many proctoring systems assign a risk score to each exam session based on detected behaviors. This distribution can reveal systemic issues or concentrated areas of concern.
Understanding the spread of integrity scores helps identify if cheating attempts are isolated incidents or indicate a broader problem within certain departments or assessment types. It can highlight areas where instructional design might inadvertently encourage cheating or where students might lack understanding of academic integrity policies. This data is invaluable for strategic interventions.
To utilize this metric effectively, establish clear thresholds for what constitutes low, medium, and high integrity risk. Compare distributions across different courses, programs, or cohorts to pinpoint outliers. Use this information to initiate targeted educational campaigns on academic integrity or review assessment design for specific courses showing high-risk patterns. Consider integrating this with student success initiatives.
6. Proctoring Effectiveness Index
The Proctoring Effectiveness Index is a composite score that reflects the overall efficiency and impact of your proctoring program. It combines various factors such as detection rates, prevention success, and false positive rates into a single, comprehensive indicator. This provides a high-level view of your program's performance.
This index is critical for understanding the holistic success of your integrity efforts, moving beyond individual metrics. It allows deans to quickly grasp whether their investments in proctoring technology and training are yielding desired results. A rising index indicates improved prevention and detection, while a declining one signals areas needing immediate attention.
To calculate and improve this index, collaborate with your proctoring vendor to define a meaningful formula based on your institutional priorities. Regularly review the components contributing to the index and identify areas for improvement. This might involve additional proctor training, technology updates, or revised student communication strategies. Consistent monitoring is key.
7. Cost Per Secured Exam
This metric calculates the total expenditure on exam integrity solutions (including software, human proctors, training, and overhead) divided by the number of exams successfully secured. It provides a clear financial perspective on the investment required to maintain assessment integrity.
The cost per secured exam is a vital metric for budget justification and demonstrating return on investment. It allows deans to compare the efficiency of different proctoring methods or vendors. Understanding this cost also helps in strategic planning and allocating resources effectively across departments. It grounds integrity efforts in financial realities.
To optimize this cost, regularly evaluate the efficiency of your current proctoring solutions. Explore alternative technologies or service models that might offer similar or better security at a lower cost. Streamline operational processes to reduce administrative overhead. Consider how a reduction in cheating and subsequent appeals can lead to indirect cost savings, which factor into your overall ROI.
8. Stakeholder Satisfaction Score
This metric measures the satisfaction levels of key stakeholders, including faculty, students, and administrators, with the exam integrity program. It's often gathered through surveys or feedback mechanisms. High satisfaction indicates a well-implemented and accepted program.
While often overlooked, stakeholder satisfaction is crucial for the long-term sustainability and acceptance of any integrity program. Dissatisfied faculty might resist using proctored exams, while frustrated students can feel overly scrutinized, potentially impacting their overall learning experience. Positive feedback, however, builds consensus and trust.
To improve satisfaction, regularly solicit feedback through anonymous surveys and focus groups. Address common pain points identified by students (e.g., technical issues, perceived invasiveness) and faculty (e.g., ease of use, incident review workload). Clearly communicate the benefits of the integrity program and how feedback is being used to make improvements. Transparency is key to building positive sentiment.
Building Your Exam Integrity Dashboard
Collecting these metrics is only the first step; presenting them in an actionable and understandable format is equally important. An effective exam integrity dashboard provides a centralized view of all critical data, tailored to different stakeholders. Deans, faculty, and IT administrators will each require specific insights relevant to their roles.
For deans and executive leadership, dashboards should focus on high-level KPIs like the Proctoring Effectiveness Index, Compliance Coverage, and Cost Per Secured Exam. These views should offer quick summaries, trends over time, and comparisons across departments. The emphasis is on strategic oversight and ROI justification.
Faculty members, on the other hand, might need dashboards that highlight suspicious behavior detection rates for their specific courses, along with incident resolution times. This allows them to manage academic integrity within their classes efficiently. IT teams would benefit from granular data on identity verification success rates and system performance.
Ensure your dashboard can display both real-time data for immediate operational insights and historical trends for strategic analysis. The ability to integrate with existing learning management systems (LMS) or student information systems (SIS) is crucial for seamless data flow and a unified view of student performance and integrity. Simple visualizations like charts and graphs make complex data digestible.
Implementation Roadmap: From Metrics to Action
Putting these metrics into practice requires a structured approach. Here is a practical roadmap to help your institution move from identifying metrics to achieving tangible improvements in exam integrity:
Phase 1: Assessment & Baseline (Weeks 1-4) Begin by evaluating your current assessment integrity practices and data collection capabilities. Identify which of the eight metrics you can currently track, even if manually. Establish baseline values for these metrics. This initial assessment helps you understand your starting point and pinpoint immediate gaps in your reporting. Involve key stakeholders from faculty, IT, and administration to gather diverse perspectives.
Phase 2: Tool Selection & Implementation (Weeks 5-12) Based on your assessment, research and select exam integrity solutions that align with your needs and budget. Prioritize tools that can automatically collect and report on your chosen metrics. Work with your chosen vendor to implement the solution, configure it to your institutional policies, and conduct pilot programs with selected courses. Ensure comprehensive training for all users during this phase.
Phase 3: Data Collection & Analysis (Months 3-6) Once the solution is live, focus on consistent data collection. Regularly review the metrics, looking for trends, anomalies, and areas of concern. Conduct initial analyses to identify patterns in suspicious behavior, areas of compliance risk, or inefficiencies in your incident resolution process. Use this period to refine your data collection methods and reporting dashboards. Present preliminary findings to stakeholders.
Phase 4: Optimization & Scaling (Months 6+) Based on your data analysis, implement targeted strategies to improve your metrics. This might include refining proctoring protocols, updating academic integrity policies, or enhancing student communication. Continuously monitor the impact of these changes on your metrics. As you see success, scale the improved processes across more departments and programs, always seeking further optimization. Regular review meetings with deans and other leaders are vital for continued success.
Regional Compliance Considerations
When tracking exam integrity metrics, it's vital to consider the diverse regulatory landscapes across different regions. What is acceptable in one country might violate privacy laws in another, directly impacting how you collect and report data. Understanding these nuances is key to maintaining compliance and trust.
In North America, the Family Educational Rights and Privacy Act (FERPA) in the U.S. heavily influences data handling for student records. Institutions must ensure that all collected exam integrity data, especially personal identifying information, is stored securely and accessed only by authorized personnel. State-specific privacy laws also add layers of complexity.
Europe operates under the stringent General Data Protection Regulation (GDPR), which demands explicit consent for data collection, transparency in data processing, and robust data protection measures. Exam integrity solutions must be designed with "privacy by design" principles, allowing students greater control over their data and clear pathways for data deletion requests.
The Middle East and Asia present diverse regulatory environments, often with specific cultural considerations regarding surveillance and data privacy. Some regions might have less developed data protection laws, while others, like Singapore or Japan, have comprehensive frameworks. Institutions operating internationally must develop a multi layered compliance strategy, potentially adjusting their integrity monitoring approaches based on student location.
A practical strategy is to map the specific compliance requirements of each region where your students or test-takers are located against your data collection and storage practices. Work with a proctoring provider that offers customizable settings to meet these varied regulations. Regular legal reviews of your exam integrity analytics and reporting methods are essential.
ROI Calculation Framework
Justifying investment in exam integrity analytics often comes down to demonstrating a clear return on investment (ROI). Beyond the obvious benefits of upholding academic standards, there are quantifiable financial and intangible advantages. Here’s a framework to help calculate your ROI.
Direct Cost Savings: These are immediate, measurable reductions in expenses. For example, effective proctoring can reduce the number of disputed exam results, thereby cutting down on the administrative time spent on investigations and appeals. It can also minimize the need for manual proctors for every single exam, leading to savings in personnel costs. Consider the reduced cost of re-administering exams due to widespread integrity breaches. Institutions can track the hours saved by faculty and administrative staff.
Indirect Benefits: These are harder to quantify financially but are equally important. Protecting your institution's reputation is paramount; a strong academic integrity record enhances your standing and attracts quality students. Maintaining accreditation through robust integrity processes avoids potential sanctions or loss of funding. Furthermore, a fair assessment environment improves student confidence in the value of their degrees and the institution's commitment to equity. These benefits contribute to long-term institutional health and growth.
Template ROI Calculation: You can use a simple formula: (Total Benefits - Total Costs) / Total Costs * 100%. Total benefits include both direct cost savings and an estimated monetary value of indirect benefits. For instance, if you prevent 10 costly appeals at $500 each, that's $5,000 in direct savings. If improved reputation leads to a 1% increase in enrollment, calculate the tuition revenue gain. Track your investment in proctoring solutions, training, and operational overhead. Regularly update these figures to show ongoing value.
For example, a university implementing comprehensive exam integrity analytics might spend $50,000 annually on software and training. Over the year, they might save $30,000 in reduced investigation hours, prevent $10,000 worth of re-tests, and attribute a $20,000 value to enhanced reputation leading to increased applications. The total benefit is $60,000, yielding an ROI of ($60,000 - $50,000) / $50,000 * 100% = 20%. This data is compelling for justifying investments to your board.
Future Trends in Exam Integrity Analytics
The field of exam integrity is continuously evolving, driven by technological advancements and the ever-changing landscape of academic dishonesty. Staying abreast of these trends is crucial for deans and assessment leaders to future-proof their integrity strategies.
AI and Machine Learning Advancements: The next generation of exam integrity analytics will leverage increasingly sophisticated AI and machine learning algorithms. These systems will move beyond simple behavioral flagging to recognize complex patterns of collusion, detect AI-generated content with higher accuracy, and even adapt to new cheating methods in real time. This will lead to more nuanced and precise detection, reducing false positives.
Integration with Learning Management Systems (LMS): Deeper integration between exam integrity platforms and LMS will create a more seamless and holistic view of student performance and integrity. This means that integrity data can be directly linked to grades, course progress, and student profiles, providing faculty with a complete picture. Such integration will streamline workflows for faculty and provide richer data for academic integrity analytics.
Blockchain for Immutable Records: While still emerging, blockchain technology holds promise for creating tamper-proof records of exam events and integrity data. This could
provide an immutable audit trail for proctoring sessions, ensuring that all actions and data points are permanently recorded and verifiable. This level of transparency and security could significantly enhance the trustworthiness of assessment processes, particularly for high stakes certifications.
Conclusion
Maintaining exam integrity is an ongoing and critical endeavor for every educational institution. By embracing a data-driven approach and focusing on the eight essential metrics discussed, deans and assessment leaders can move beyond reactive measures to proactive, strategic oversight. These metrics—from identity verification success to stakeholder satisfaction—provide the insights needed to protect academic standards, ensure compliance, and prove the value of your integrity initiatives.
Starting your journey with exam integrity analytics doesn't require overhauling your entire system overnight. Pick two or three metrics that are most critical to your institution's immediate goals, establish baselines, and begin tracking. Consistent monitoring and iterative improvements based on these data points will gradually transform your approach to assessment security. This commitment to data-informed decisions not only safeguards your institution's reputation but also upholds the value of every degree awarded.
Empower your institution with the knowledge and tools to confidently ensure fair and secure assessments. By leveraging these practical strategies and key metrics, you can build a robust framework that supports academic excellence and prepares your students for future success.
FAQs
1. What are the most important exam integrity metrics for accreditation purposes?
For accreditation, institutions primarily need metrics that demonstrate a consistent and effective commitment to academic honesty. The most important metrics typically include the Compliance Coverage Percentage, showing adherence to data privacy and accessibility standards, and the Proctoring Effectiveness Index, which gives an overall measure of your program's success in preventing and detecting misconduct.
Accreditors often require evidence of fair and equitable assessment practices. Therefore, the Incident Resolution Time is also crucial, as it proves that integrity issues are addressed
promptly and consistently. Documenting your processes and showing trend data for these metrics over time provides compelling evidence of your institution's dedication to maintaining high academic standards.
2. How do we calculate ROI for exam proctoring and integrity solutions?
Calculating the Return on Investment (ROI) for exam integrity solutions involves quantifying both direct cost savings and indirect benefits. Direct savings include reduced administrative time for investigations and appeals, lower costs associated with re-administering exams due to widespread cheating, and potential savings on manual proctoring services.
Indirect benefits, while harder to assign a precise dollar value, are equally important. These include protecting your institution's reputation, enhancing student trust in their degrees, and ensuring compliance with accreditation requirements, which can prevent substantial financial penalties or loss of funding. To calculate, sum all benefits (direct + indirect estimated value),
subtract total costs (software, training, overhead), then divide by total costs and multiply by 100% to get a percentage. Regularly tracking these factors allows you to present a compelling case for your investments.
3. What's the acceptable false positive rate for exam cheating detection?
The acceptable false positive rate for exam cheating detection varies significantly by institution and the stakes of the exam. There's no single industry-wide benchmark, as the balance often lies between aggressive detection and minimizing student inconvenience or wrongful accusations. Generally, institutions strive for as low a false positive rate as possible, ideally below 5%, to maintain student trust and reduce the administrative burden of reviewing non-issues.
A higher false positive rate can lead to student frustration, increased appeals, and a heavier workload for faculty reviewing flagged incidents. Conversely, a rate that is too low might indicate that genuine instances of misconduct are being missed. The key is to continuously refine your system's algorithms and human review protocols to strike the right balance, ensuring fairness while effectively deterring cheating. Regular feedback from students and proctors can help calibrate this rate effectively.
4. How do we ensure exam integrity across different regions with varying regulations?
Ensuring exam integrity across diverse regions requires a multi-faceted approach to navigate varying regulatory landscapes. Begin by meticulously mapping the data privacy laws (like GDPR in Europe, FERPA in the US) and other relevant regulations in each region where
your students take exams. This includes understanding consent requirements for data collection and retention policies.
Partner with an exam integrity solution provider that offers flexible configurations to comply with these different regulations, allowing you to customize settings for different student cohorts or geographic locations. Develop clear, region-specific communication materials for students explaining data practices and proctoring protocols. Implement robust data security measures and conduct regular audits to ensure ongoing compliance, adapting your strategies as regulations evolve globally.
5. What dashboard features do deans and board members actually use?
Deans and board members typically focus on high-level, strategic metrics rather than granular operational details. They value dashboards that offer a clear, concise overview of the overall health of the exam integrity program. Key features they frequently use include the Proctoring Effectiveness Index, providing a composite score of program success, and the Compliance Coverage Percentage, to ensure legal and accreditation adherence.
They are also interested in the Cost Per Secured Exam, which helps justify budget allocations and demonstrates ROI, along with the Stakeholder Satisfaction Score, indicating buy-in and acceptance across the institution. Dashboards for these audiences should feature easy-to-understand visualizations, trend analysis over time, and comparisons across different departments or cohorts, enabling quick, informed decision-making without getting bogged down in specifics.